

Programming the Arduino Shield test circuit was done in two parts. One program focused on the AM2320, and the other on the photocell and LED.
Writing the code separately as I did was completely optional, and it can be done all at once in one program.
However, since I am a novice when it comes to coding, I wanted to program the components separately to try to create fewer problems and minimize confusion.
In short, I wanted to get one component working well at a time.
AM2320 Code
Programming the AM2320 was rather simple. The chip was purchased from Adafruit.com where setup instructions and code were available.
Link: https://learn.adafruit.com/adafruit-am2320-temperature-humidity-i2c-sensor/overview
I used this sensor to test the data logger itself, and to make sure I was able to store information before moving on to something more complex.
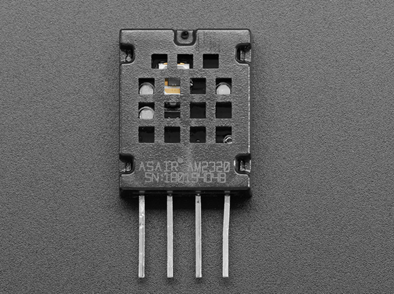
All I needed to be do was wire the sensor, download the code and the AM2320 library in the Arduino IDE, and run!
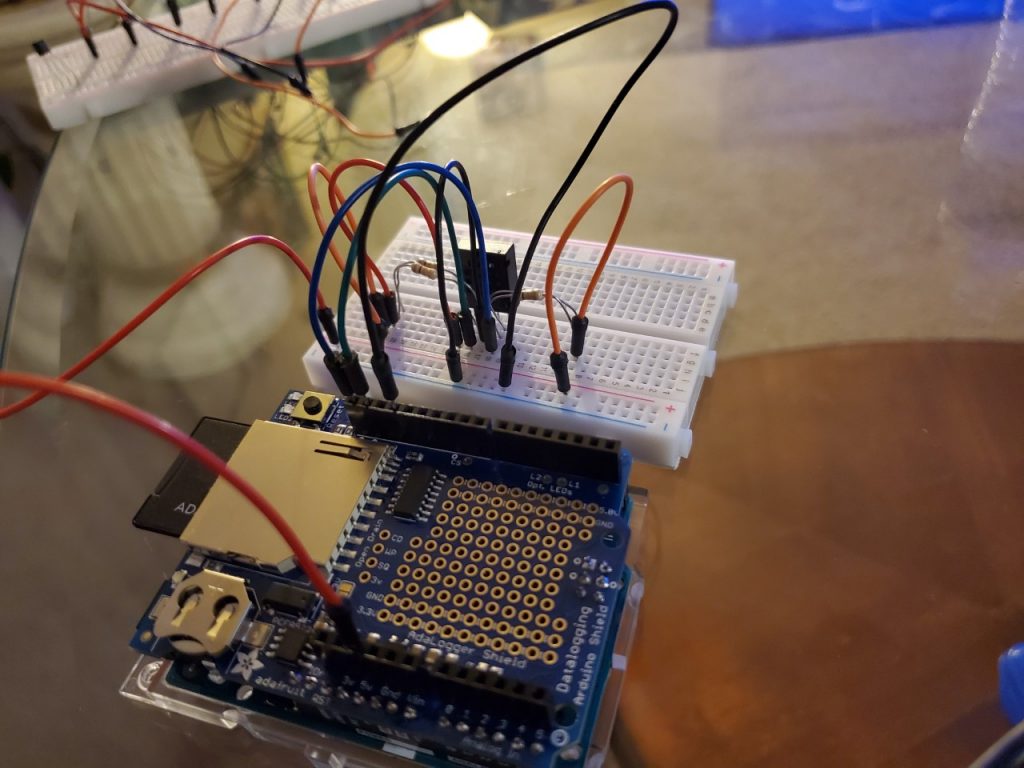
Here is another look at the wire schematic:
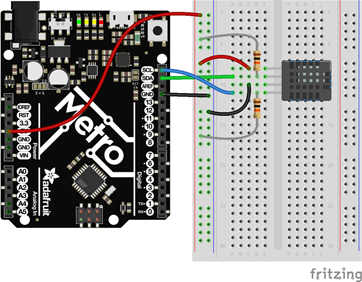
As a reminder, the connection calls for two 10k ohm resistors to connect to the SDA and SCL pins, respectively. I used two sets of 20k ohm resistors in parallel to obtain 10k ohms.
Code:
This is the working code that was available on Adafruit.com. Temperature printed in Celsius only. I added a line to convert from Celsius to Fahrenheit and to print it upon running.
// Using the AM2320 sensor, this code prints the temperature and humidity to the serial monitor
#include "Adafruit_Sensor.h"
#include "Adafruit_AM2320.h"
Adafruit_AM2320 am2320 = Adafruit_AM2320();
void setup() {
Serial.begin(9600);
while (!Serial) {
delay(10); // hang out until serial port opens
}
Serial.println("Adafruit AM2320 Basic Test");
am2320.begin();
}
void loop() {
float tempC = am2320.readTemperature();
float tempF = tempC * 1.8 +32; //converts Celsius to Fahrenheit // added line to code
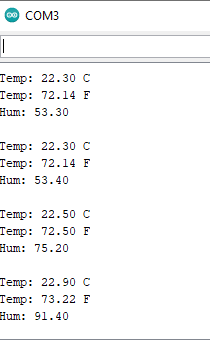
Serial.print("Temp: "); Serial.print(am2320.readTemperature()); Serial.print(" C"); Serial.print("\n");
Serial.print("Temp: "); Serial.print(tempF); Serial.print(" F"); Serial.print("\n"); //added line to code
Serial.print("Hum: "); Serial.print(am2320.readHumidity()); Serial.println("\n");
delay(2000);
}Results
AM2320 Code for Data Logging
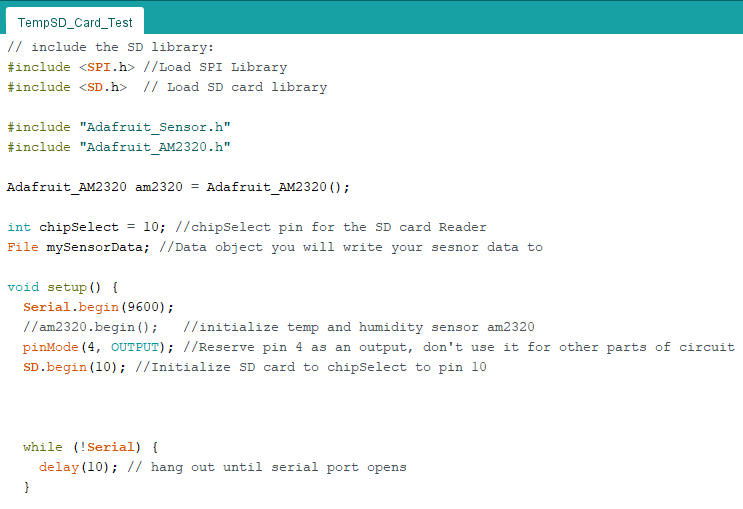
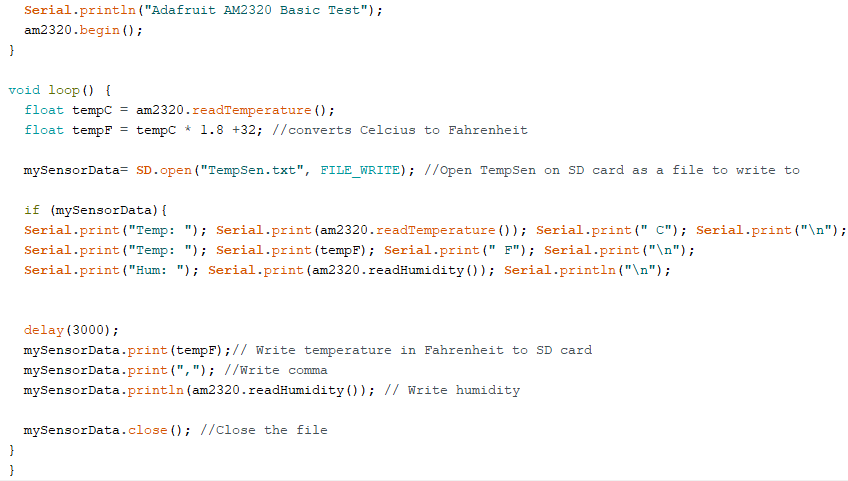
In order to log data, the information needed to be stored on the SD card.
Now that I had the AM2320 sensor working properly, I added a few more lines of code to allow information to print to the SD card inside of the data logger.
In addition to storing data on the SD card, the code was modified to only store the Fahrenheit and humidity temperatures.
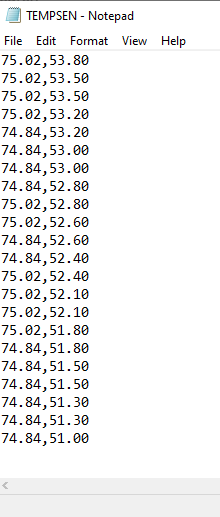
Logging Results
Here is a text file on the SD card with the values that were obtained:
Now that I had the AM2320 working and was able to log data, I moved on to the photocell and LED.
Photocell and LED
The photocell and the LED were used to simulate motion, in which “On” indicated forward motion and “Off” indicated backward motion.
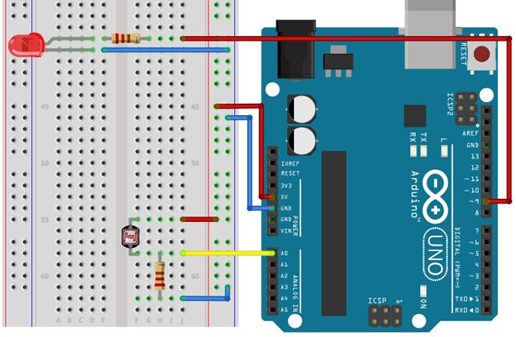
Here is another look at the wire schematic:
Code
The photocell was programmed to turn the LED on when the photocell reached a value below 400. When a value above 540 was reached, the LED turned off.
//This program turns LED on and off by covering or uncovering the photocell
// Define analog pin
int sensorPin = 0;
int lightPin = 2;

//Variables
int listeState = 0;
int lowThreshold = 400;
int highThreshold = 540;

//Setup
void setup() {
  //Init serial
  Serial.begin(9600);
  pinMode(lightPin,OUTPUT);
}
//Main loop
void loop() {

  //Get temperature
  int sensorValue = analogRead(sensorPin);

  //If light level is low is detected,switch light on
  if(sensorValue < lowThreshold) {
    digitalWrite(lightPin, HIGH);
  }
  //If light level goes up again, switch light off
  if(sensorValue > highThreshold) {
    digitalWrite(lightPin,LOW);
  }
  //Put temperature on the serial port
  Serial.println(sensorValue,DEC);

  //Wait for 1 sec
  delay(1000);
}
The thresholds were found after a few test trials. I’d let the photocell read values uncovered. That value was typically above 540. As I covered the photocell, the values would decrease quickly at first, but then the values leveled around 370. You’ll see this below in the output results of the code.
Results
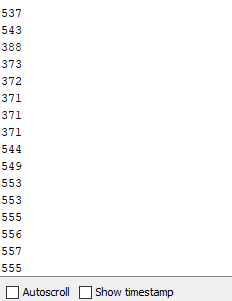
So, I chose 540 to be my highThreshold and 400 to be my lowThreshold.
There are many ways to program the photocell and LED.
As I type this post, I can think of one method that of which involved condensing the code by removing the threshold, and having one single if-statement.
This would simply turn on the LED if the photocell had readings below or equal to a certain value, say 400. Any value above 400 would turn the LED off.
However, everything is a learning process.
After obtaining these values, I went on to incorporate the RTC and SD card from the data logger. The RTC would track date and time.
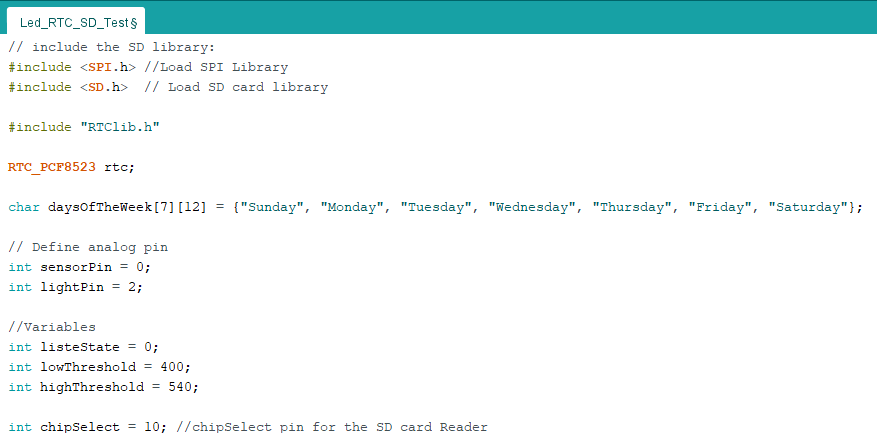
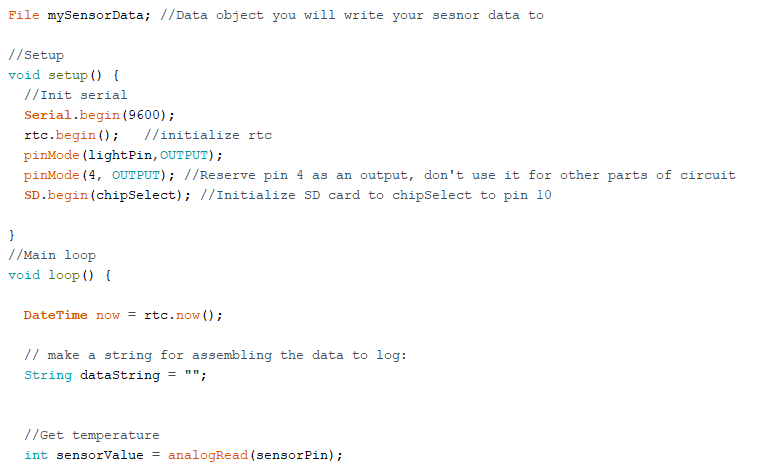
Photocell and LED Code for Data Logging
To use the built-in RTC, I downloaded its library in the Arduino IDE.
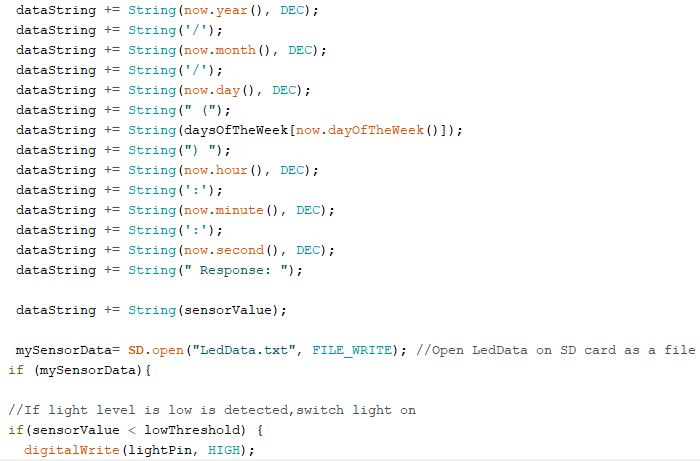
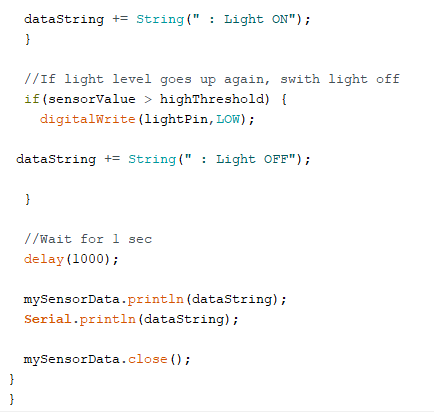
Then, as mentioned, I modified the code to read the time from the built-in RTC on the data logger and store the information to the SD card. I also added some lines that would print whether the light was on or off, and the value of the photocell.
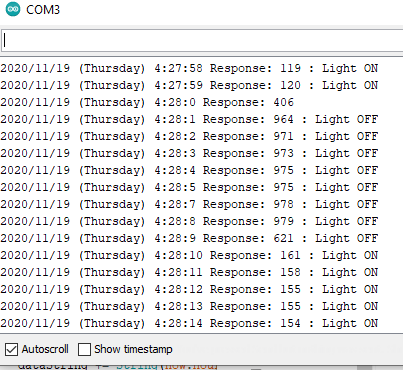
Results
Here is a text file depicting the output results:
Looking ahead, the next challenge would be to print the exact duration that the LED is in an “ON/OFF” state which would indicate how long the MROC was driving “forward/backward” in a simulation environment.
An additional challenge would be to determine a method to account for when the MROC is not in motion.


3 Responses
This is a great explanation for setting up the AM2320 Sensor! I believe that it was especially insightful how you went about logging the data in stages with the serial output (gradually becoming more complex) to ensure your results were accurate.
This post is fantastic! As stated in another post, I am very keen to looking at code to see how something operates, so I love that the information and details about the code are so easy to comprehend. Great job!
I liked how you walked through your process of doing things, makes it easier for me to understand. I also liked that you explained each section of code.